
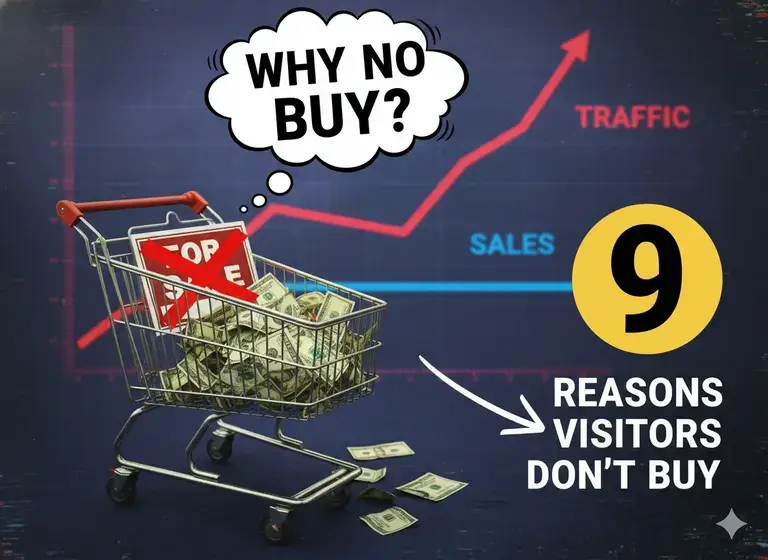
You’ve done the work. Pages rank. Analytics shows consistent traffic. Sessions are ticking up every month.
But your CRM tells a completely different story. Inquiries trickle in. Sales are either absent or nowhere near where they should be given the traffic numbers you’re looking at.
You’ve probably tried the standard fixes. Changed the call-to-action. Added a testimonial section. Maybe ran a quick A/B test on your contact form. Nothing moved in any meaningful way.
Here’s what most articles about this problem won’t tell you: those fixes weren’t wrong. They were just solving the wrong problem.
Traffic without conversions is almost never a button-color problem or a form-length problem. It’s a diagnostic problem. You’re applying tactical solutions to a structural breakdown without first identifying where the structure actually broke.
This guide gives you a working diagnostic. Not a list of twenty things to try. A sequenced process for identifying which specific failure mode explains your situation, what to do about it in the right order, and how to measure whether it’s working.
Table of Contents
Why Everything You’ve Tried Hasn’t Worked
Most advice on this problem starts in the wrong place.
It assumes the issue is in your conversion mechanics: your pages, your CTAs, your forms. So it tells you to optimize those things. And when that doesn’t produce results, the advice gets louder: test more, add more proof, redesign your landing page.
Here’s what most people misunderstand: conversion mechanics are the third problem you should solve, not the first. Fixing a broken CTA when your traffic has no buying intent is like sharpening a knife when the recipe is wrong. The knife isn’t the issue.
The traffic-conversion gap almost always comes from one of three structural failures:
- Traffic intent mismatch: you’re attracting people who are not ready to buy and may never be, regardless of what your site says
- Trust infrastructure failure: visitors with genuine buying intent don’t have enough confidence in your offer to act
- Conversion pathway disconnect: even motivated, trusting visitors can’t find a clear, frictionless path from where they are to taking action
Most sites have some degree of all three. But there’s almost always a dominant failure mode, one that explains 60 to 70 percent of the conversion gap. Finding that dominant failure is the work. Fixing it first is how you get traction quickly.
The diagnostic process below works through each failure mode in the order they should be investigated. Don’t skip ahead.
Failure Mode 1: Traffic Intent Mismatch
This is the most common cause of the traffic-conversion gap. It’s also the most invisible one, because the traffic looks fine in your analytics. Sessions are real. Engagement is decent. Organic growth is real. But the traffic is the wrong type for your offer.
What Intent Mismatch Actually Means
Search intent exists on a spectrum. On one end: informational intent. People searching “how to reduce customer churn” or “what is topical authority” are learning. They’re not in buying mode. On the other end: transactional intent. People searching “SaaS SEO consultant” or “content strategy agency pricing” are ready to act. They’ve done their research. They’re evaluating options.
The conversion problem occurs when most of your traffic comes from informational searches while your business requires transactional or commercial intent to generate revenue.
Your blog might rank for ten educational articles driving hundreds of visits per month. Those visitors are engaged and curious. They’re not buyers. And every informational article you publish without a structured path toward commercial consideration adds to what I call intent debt: a widening gap between the awareness you’re generating and the buying intent your business actually needs.
In practical terms: intent debt compounds silently. You keep publishing, traffic keeps growing, and conversion rates keep looking the same. The underlying cause doesn’t show up in your traffic dashboard. It shows up in your revenue reports.
How to Diagnose Traffic Intent Mismatch
This diagnostic takes less than 60 minutes.
Step 1: Open Google Search Console → Performance → Search Results. Set the date range to the last 90 days. Filter by Web.
Step 2: Export your top 30 queries sorted by clicks, not impressions. Clicks are what actually brought people to your site. Impressions are just visibility.
Step 3: Classify each query by intent type:
| Intent Type | Signals in the Query |
|---|---|
| Informational | how, what, why, guide, tips, meaning, what is, how to |
| Commercial | best, vs, comparison, review, alternatives, top, pricing |
| Transactional | hire, buy, get, contact, agency, consultant, service, for [specific outcome] |
Step 4: Count the distribution. What percentage of your top 30 queries fall into each category?
The diagnostic benchmark: For a site that should generate consistent leads or direct sales, at least 30 percent of your top traffic-generating queries should be commercial or transactional in nature. If that number is below 20 percent, traffic intent composition is your primary problem, and no amount of on-site optimization will produce meaningful conversion improvement until you address it.
What the Data Tells You
If 60 percent or more of your top queries are informational: Your site is functioning as a content resource, not a conversion engine. The traffic is real and could be valuable, but it isn’t conversion-ready by nature. The fix is strategic, not tactical.
If 30 to 60 percent of your top queries are informational: You have a mixed traffic base. Some commercial potential exists, but the informational bias is suppressing your overall conversion rate. Addressing intent mismatch here will unlock improvements you won’t see through on-site optimization alone.
If more than 30 percent of your top queries are commercial or transactional: Intent isn’t your primary problem. Move to Failure Mode 2.
How to Fix Traffic Intent Mismatch
You have two realistic options, and the best approach usually combines both:
Option A: Develop Commercial-Intent Content
Build pages and articles that specifically target queries with buying intent. Service comparison pages. Pricing transparency content. Problem-specific solution pages that rank for “best [solution] for [specific situation]” queries. Case studies targeting industry-specific search terms. This takes longer to rank, but it fundamentally changes your traffic quality.
Option B: Build Intent Bridges in Existing Content
For your highest-traffic informational pages, add structured pathways that move informed readers toward commercial consideration. A contextually relevant internal link to a specific case study. An inline mention of how the concept you’re explaining connects to a real problem you solve. A content upgrade or next step that deepens engagement without feeling like a sales pitch.
Option B produces faster results. Option A produces more durable ones. Both are necessary at scale.
How to Measure Improvement
Track these three metrics monthly in Google Search Console and GA4:
Intent distribution score: The percentage of your top 30 queries by clicks that are commercial or transactional. Baseline this number today. Target: 30 percent or more within six months of consistent commercial-intent content development.
Organic-to-commercial-page progression rate: In GA4, build an exploration path from your blog landing pages to your service, pricing, or case study pages. What percentage of blog visitors ever reach a commercial page? Baseline this. Target: 5 to 8 percent progression rate, meaning 5 to 8 out of every 100 blog visitors engage with commercial content.
Conversion rate by landing page type: Segment your GA4 conversion data by the page where sessions started. Blog pages, service pages, and case study pages should each show distinct conversion rates. If all are near zero, the problem may be deeper than intent.
Failure Mode 2: Trust Infrastructure Failure
Assuming your traffic includes genuine commercial intent, meaning people actively considering your category of solution, the next question is whether they trust you enough to act.
Not whether they’re aware of you. Whether they trust you.
Most websites confuse trust signals with trust infrastructure. The difference matters significantly.
Trust signals are visible: a testimonial section, a client logo bar, a star-rating badge. They exist on the page. They’re easy to add.
Trust infrastructure is the underlying system that makes those signals credible. It’s built from specificity, consistency, contextual alignment, and demonstrated competence. A generic testimonial like “Great service, highly recommend!” is a trust signal with almost no trust infrastructure behind it. It’s noise, not evidence.
In practice, buyers don’t convert on trust signals alone. They convert when the full context of your site, including your language, specificity, evidence, and consistency, builds sufficient confidence that the risk of engaging is clearly lower than the potential value.
The Five Dimensions of Trust That Actually Drive Conversions
1. Specificity of Positioning
Vague positioning destroys trust quietly. “We help businesses grow online” could describe 100,000 companies. It communicates nothing specific enough to evaluate.
Compare it to: “We help B2B SaaS companies between $2M and $15M ARR build organic search systems that reduce reliance on paid acquisition within 12 to 18 months.”
That second statement is specific enough to evaluate. A visitor who fits that description knows immediately whether this is relevant to them. Specificity communicates competence because it demonstrates that you understand the problem at a level generalizations can’t reach.
2. Social Proof That Mirrors the Prospect
The question your potential client is asking isn’t “does this business have testimonials?” It’s “have people like me succeeded with this?”
If you serve SaaS companies but your case studies feature eCommerce clients, the trust doesn’t transfer. The visitor needs to see their specific situation reflected in your evidence: their industry, their scale, their problem. Misaligned social proof is almost as bad as no social proof, because it highlights that your experience isn’t directly relevant to them.
3. Site-Wide Consistency
Trust degrades with every inconsistency a visitor encounters. A professional homepage undermined by a blog with its last post from 18 months ago, a case studies page that doesn’t load, or an About section that reads like a placeholder. These signals accumulate into a quiet sense that the business isn’t paying close attention.
The implicit logic: if the business doesn’t maintain its own presence carefully, why would it handle a client project any differently?
Trust is built across an entire experience, not on a single page.
4. Process Transparency
A service page that describes benefits without describing how you actually deliver them is asking for trust it hasn’t earned.
Buyers need to understand the process: what happens after they contact you, what the onboarding looks like, how work gets done, what a typical engagement involves. Process clarity reduces perceived risk. It shows the buyer that you’ve thought through what they’re about to experience.
5. Evidence Quality Over Evidence Volume
Three specific, results-quantified case studies outperform 20 vague testimonials.
“We rebuilt their topical authority structure, fixed six critical crawlability issues, and grew their organic demo request traffic by 140 percent over nine months” is worth more trust than “Amazing to work with, highly recommend!” The first statement demonstrates what you did, how you did it, and what it produced. The second statement contributes almost nothing.
Evidence that quantifies outcomes, describes the situation, and explains the approach is the standard worth targeting.
Running the Trust Infrastructure Audit
Score your site against each dimension on a 1 to 5 scale:
| Dimension | 1: Critical Weakness | 5: Strong |
|---|---|---|
| Specificity | “We help businesses grow” | “We work with [specific client type] to achieve [specific, measurable outcome]” |
| Social proof alignment | No match to your target industry or client type | Direct match: same industry, same problem profile |
| Site-wide consistency | Outdated, broken, or inconsistent sections visible | Coherent, maintained, updated presence throughout |
| Process transparency | Service page describes outcomes only, no process detail | Clear methodology, timeline, and client journey explained |
| Evidence quality | Generic testimonials only | Specific, outcome-quantified case studies with context |
The threshold: An average score below 3.5 across these five dimensions is a meaningful trust barrier. It will suppress conversions even when your traffic has commercial intent and your conversion mechanics are functional.
Measuring Trust Infrastructure Effectiveness
Trust page engagement rate: In GA4, track the engagement rate on your case study, About, and testimonials pages. Low engagement on trust pages means visitors aren’t using them as part of their decision process. You’re leaving a key conversion lever uncaptured.
Trust page visit correlation with conversion: In GA4, create a segment of users who visited at least one trust page during their session. Compare their conversion rate to users who didn’t visit any trust page. If trust page visitors convert at a significantly higher rate, which they almost always do, improving the quality of those pages is a direct and measurable revenue lever.
Scroll depth on commercial pages: Use Microsoft Clarity or GA4’s scroll tracking. Visitors who scroll through 75 percent or more of your service or pricing page are demonstrating real consideration. Below 50 percent average scroll depth on a critical commercial page suggests a trust or clarity problem near the top of the page.
Failure Mode 3: Conversion Pathway Disconnect
This is the failure mode most conversion optimization articles focus on. And it is a real problem. But it’s rarely the primary problem, and optimizing it before addressing intent and trust produces minimal results.
Once your traffic is reasonably qualified and your trust infrastructure is solid, conversion pathway issues become the dominant barrier. The visitor wants to engage. They’ve found the evidence they need. They just can’t find a clear, low-friction path from where they are to taking action.
What a Broken Pathway Looks Like in Practice
No specific next step: Your service page explains your offer clearly and builds reasonable confidence. Then it ends. There’s a generic contact form at the bottom with no reason to fill it out right now. No specific offer. No clear value attached to the next interaction. No indication of what happens after they click submit.
Visitors in this situation do what most people do with unclear next steps: they leave and say they’ll “come back later.”
Friction stacking: Multiple required form fields for an initial inquiry. Mandatory account creation before any value is delivered. Button labels that say “Submit” or “Click Here” with no indication of what happens next. Checkout flows with more steps than necessary. Each friction point reduces completion probability by a measurable amount. Three or four stacked together produce significant conversion suppression, not dramatically but consistently.
Stage-mismatched content: An evaluating visitor needs specific outcomes, detailed process information, and case studies. A purchase-ready visitor needs pricing clarity and reassurance about the immediate next step. If your commercial pages deliver the same generic content regardless of where the visitor is in their decision, both groups leave with at least one critical question unanswered.
Ambiguous offer structure: The visitor reaches your pricing or services page and still can’t clearly understand what they’ll receive, how the process works, or what success looks like for them specifically. Confusion stops decisions faster than almost anything else.
How to Diagnose Conversion Pathway Problems
Install Microsoft Clarity (free, installs in minutes, provides session recordings and heatmaps). This is non-negotiable for this diagnostic.
Watch 15 to 20 session recordings of visitors who landed on a commercial page (service, pricing, or case study) and then left without converting. Look specifically for:
- Where they stopped scrolling (everything below that point effectively doesn’t exist for them)
- Rage clicks: repeated clicks on elements that aren’t responding, signalling high frustration
- Dead clicks: clicks on elements that look interactive but aren’t, signalling confusion about what’s clickable
- Cursor hesitation: cursor movements that indicate uncertainty about what to do next
- Specific exit points: which page or section triggers departure consistently
Build a funnel exploration in GA4:
- Navigate to Explore → Funnel Exploration
- Define your intended conversion path: the sequence of pages you expect visitors to move through (e.g., Blog Post → Service Page → Contact Page → Thank You Page)
- Identify where the highest percentage of users drop out
- That drop-off point is your primary pathway bottleneck
Measure your form start-to-completion rate: In GA4 with Enhanced Measurement enabled, track form interactions. The gap between form starts and completions tells you directly how much friction exists in your primary conversion action. A completion rate below 40 percent on a standard contact form is a signal that the form itself, whether its length, labels, or positioning, is creating unnecessary friction.
How to Fix Conversion Pathway Problems
Fix these in order of impact, not in order of ease:
1. Clarify the specific next step: Every commercial page needs an action prompt that is specific about what happens next. Not “Contact Us” but something like: “Schedule a 30-minute strategy call. We’ll review your current search performance, identify the two or three highest-impact opportunities, and give you a clear recommendation whether or not we work together.” The specificity of the next step directly reduces the perceived risk of taking it.
2. Reduce form fields to the minimum necessary: For an initial inquiry, name and email are almost always sufficient. Phone number, company size, annual revenue, and “how did you hear about us” can come later. Every required field that isn’t essential to initiating the conversation costs you completions.
3. Make CTAs describe outcomes, not actions: “Get My SEO Audit” outperforms “Submit.” “Book Strategy Call” outperforms “Contact Us.” “Download the Framework” outperforms “Click Here.” Specific CTAs reduce ambiguity about what happens next and increase completion rates measurably.
4. Add decision-stage content: One page near the end of your conversion journey specifically designed to answer purchase-stage questions: what does onboarding look like, what’s a typical project timeline, what should I prepare before our first call, what happens if it’s not a fit? This content addresses the objections and uncertainties that cause ready-to-act visitors to hesitate.
Measuring Pathway Improvement
| Metric | What It Tells You | Target |
|---|---|---|
| Form completion rate | Friction in your primary conversion action | 50% or higher |
| Click-to-contact rate (commercial pages) | Percentage of commercial page visitors initiating contact | Track weekly; improve 15–25% with pathway fixes |
| Scroll depth on conversion pages | Whether visitors engage with full-page content | 60%+ average on service and pricing pages |
| Sessions before conversion | Complexity of the decision journey | Track directional trend; shouldn’t increase without conversion volume increasing |
The Offer Clarity Problem: The Root Cause Underneath Every Other Failure
Before a visitor evaluates your trust signals. Before they navigate your conversion pathway. Before their intent level determines anything, your offer needs to be clear enough for the right person to immediately recognize that it’s relevant to them.
Most conversion problems start here, and most conversion optimization work skips this step entirely.
Offer clarity is the degree to which a first-time visitor, within 30 seconds, can accurately answer these four questions without effort:
- What does this business actually do?
- Who specifically is it for?
- What result does it produce?
- What’s the first step?
Test this right now. Show your homepage to someone who doesn’t know your business. Ask them those four questions. Write down their answers. The gap between what they describe and what you intended to communicate is your offer clarity gap.
Most businesses fail this test not because the design is poor, but because the language is built around what the business wants to say rather than what a potential client needs to understand in order to decide.
The most common symptom is benefit language that sounds credible but communicates nothing specific.
“We help businesses scale their digital presence.” Sounds professional. Means almost nothing.
“We help B2B software companies rank for the search queries their best prospects use when evaluating solutions, and convert that traffic into consistent pipeline.” That’s specific enough to evaluate relevance immediately.
The difference isn’t style. It’s signal clarity. Vague language forces the visitor to do interpretive work: figuring out whether this applies to their situation, whether the framing matches their problem, whether this business understands their context. Most visitors won’t do that work. They’ll move on.
Specific language does that interpretive work for them.
Offer clarity affects all three failure modes: Commercial-intent visitors don’t convert when they can’t quickly determine relevance. Trust doesn’t build around vague positioning. The conversion pathway creates friction when the offer itself isn’t clear enough to anchor a decision.
The Fix
Rewrite your homepage hero section and your primary service page opening using this structure:
“We help [specific client profile] achieve [specific, measurable outcome] through [specific approach or methodology].”
Then add: “Here’s how it works.” And actually explain it, in plain language, step by step, without assuming any prior knowledge of your process.
This is a messaging task, not a design task. The visual layout of your page matters far less than what it says.
Measuring Offer Clarity Improvement
After rewriting your core messaging, track these metrics over a 30-day window:
- Homepage engagement rate: A higher percentage of visitors engaging with the page after the rewrite indicates the message is landing more clearly
- Scroll depth on homepage: If visitors are reading further down the page, your opening is holding attention better
- Commercial page visit rate from homepage: Are more visitors moving from your homepage to a service or pricing page? This directional signal indicates the message is generating relevant interest
- Direct inquiry rate from organic traffic: Track contact form submissions from organic sessions over 30 days before and after the rewrite
How AI Search Is Reshaping Traffic Quality in 2026
This matters for anyone building organic traffic through content marketing.
Google’s AI Overviews now provide direct answers to a large share of informational search queries. When someone searches “what is a content gap analysis” or “how does technical SEO work,” they often receive a sufficient answer directly in the search results page without clicking through to any article.
What this means is: organic traffic previously driven by educational and definitional content is declining for many sites. Not because the content is poor, but because AI has changed where users satisfy that informational need.
The second-order effect is what matters most for the conversion equation. The visitors who still click through to websites are increasingly doing so because the AI summary wasn’t sufficient for what they needed. They want detailed implementation guidance, a specific professional perspective, or a commercial offer. The pure informational-intent visitors are getting their needs met without clicking. The visitors who remain are carrying more specific, often more commercial, intent.
In practical terms, this creates two categories of sites:
Sites most at risk: Those that built their organic traffic model on broad informational keywords (how-to guides, industry explainers, definitional content) without substantial commercial-intent content infrastructure. They’re seeing traffic volume decline, and what little commercial traffic existed within that volume is harder to retain.
Sites best positioned: Those with deep expertise content that goes beyond what AI can adequately compress into a three-paragraph summary, alongside commercial-intent pages that rank for evaluation-stage queries. Their traffic may be lower volume but higher quality, and quality is what converts.
The practical response isn’t to abandon content marketing. It’s to reorient it: from volume-driven informational publishing toward depth-driven expertise content that serves both search discovery and genuine commercial intent. Content that AI can’t easily replace because it reflects real operational knowledge, specific context, and practitioner-level analysis.
For sites already experiencing this shift: audit whether your declining traffic was ever realistically converting. In many cases, AI Overviews are exposing an intent mismatch problem that always existed. It’s now just more visible.
The Diagnostic Priority Framework: What to Fix First and How to Know It’s Working
Here’s where most people make the second-biggest mistake in this process, which is starting with the wrong diagnosis.
They read about all three failure modes. They see problems in all three areas. And they try to fix everything simultaneously. The result is unfocused effort, confounded measurement, and slow progress on all fronts because no single intervention gets enough concentrated attention to produce clear results.
The sequence matters. Work through it in order.
Step 1: Run the Traffic Intent Audit
Before changing anything on your site, understand your traffic intent distribution. Pull your top 30 queries from Search Console. Classify them by intent. Calculate the distribution.
If more than 60 percent are informational: On-site optimization will not produce meaningful conversion improvement. Start with commercial-intent content development and intent bridge implementation in high-traffic informational articles. Revisit the on-site diagnostic in 90 days.
If 30 percent or more are commercial or transactional: Your traffic has enough conversion potential to justify on-site improvement. Move to Step 2.
Step 2: Run the Trust Infrastructure Audit
Score your site on the five dimensions outlined above. Identify your lowest-scoring dimension. Build a specific improvement plan for it.
The most common quick win at this stage: rewriting your most important service or product page with specific, evidence-backed, process-transparent language. Not a redesign. A rewrite. This can be done in a week and measured in 30 days.
If your trust audit score is below 3.5 average: address this before working on conversion pathway mechanics. Trust problems suppress all downstream conversion activity regardless of how well-optimized your pathway is.
Step 3: Run the Pathway Analysis
If your trust infrastructure is solid, meaning a 3.5 average or higher, but conversions are still below expectation, the problem is mechanical. Session recordings and GA4 funnel analysis will identify it precisely. This is where CTAs, form optimization, and decision-stage content come in. Not before.
The Three-Week Diagnostic Sprint
For immediate traction:
Week 1: Traffic Intent Audit
- Export top 30 queries from Search Console
- Classify each by intent type using the framework above
- Calculate your intent distribution
- Document: is the primary problem traffic composition or on-site performance?
- Deliverable: a written intent distribution score and a clear decision on diagnostic direction
Week 2: Trust and Offer Clarity
- Score the five trust dimensions using the 1–5 rubric
- Run the 4-question offer clarity test with someone unfamiliar with your business
- Identify the single lowest-scoring trust dimension
- Rewrite your homepage hero section and primary service page opening using specific, outcome-oriented language
- Deliverable: rewritten core messaging, documented baseline engagement metrics for comparison
Week 3: Pathway Analysis
- Verify Microsoft Clarity is installed and has at least 100 sessions recorded
- Watch 15 session recordings of non-converting commercial-page visitors
- Identify the single highest-friction or highest-confusion point
- Implement one specific fix: clearer CTA copy, reduced form fields, or a new decision-stage content element
- Deliverable: documented friction point, implemented change, baseline metrics for tracking
What Success Looks Like: The 60-Day Measurement Framework
Set baselines on Day 1. Measure again on Day 30 and Day 60. Track these metrics:
| Metric | Where to Measure | Baseline | 30-Day Check | 60-Day Target |
|---|---|---|---|---|
| Intent distribution score (% commercial/transactional in top 30) | Google Search Console | [ ] | [ ] | +5–10 percentage points |
| Organic-to-commercial-page progression rate | GA4 Exploration | [ ] | [ ] | 5–8% |
| Trust page visit-to-conversion correlation | GA4 Segments | [ ] | [ ] | Trust page visitors convert at 2x+ non-trust-page visitors |
| Average scroll depth on primary service page | Microsoft Clarity or GA4 | [ ] | [ ] | 60%+ |
| Form start-to-completion rate | GA4 Form Events | [ ] | [ ] | 50%+ |
| Contact inquiry rate from organic traffic | GA4 Conversions + Organic Filter | [ ] | [ ] | +20–30% vs. baseline |
Fill in your baseline values on Day 1. These numbers matter more than any industry benchmark because they tell you what’s actually happening in your specific situation, and whether the interventions you’re making are producing measurable results.
Frequently Asked Questions
What is a normal conversion rate for organic website traffic?
There’s no universal benchmark that’s useful in isolation, because conversion rates depend heavily on your offer type, traffic intent composition, and average sales cycle length. That said, here are reasonable reference ranges: service businesses typically see organic lead rates of 0.5 to 3 percent. SaaS demo request or free trial rates from organic traffic commonly fall between 0.5 and 2 percent. eCommerce purchase rates from organic sessions usually range from 1 to 4 percent. These ranges are wide because they’re driven more by traffic intent quality than by on-site performance. A site with 60 percent informational traffic will always show lower conversion rates than a site with 60 percent commercial-intent traffic, regardless of how well-optimized the conversion mechanics are.
How do I know if my traffic problem is a content problem or an on-site conversion problem?
Segment your conversion data by landing page type in GA4. If your commercial pages (services, pricing, case studies) generate conversions from commercial-intent visitors but your blog pages produce almost nothing, your problem is traffic composition, not conversion mechanics. The site is working correctly; you’re just attracting the wrong visitors in disproportionate volume. If your commercial pages receive measurable commercial-intent traffic but still don’t convert, the issue is on-site: trust infrastructure, offer clarity, or pathway friction. If you haven’t run this segmentation yet, do that before making any changes to your site.
Can I fix this problem without redesigning my website?
In most cases, yes. The majority of traffic without sales problems are messaging problems and strategy problems, not design problems. Intent mismatch is fixed through content strategy, not design. Trust infrastructure failures are typically fixed through rewriting: adding specificity, improving case study quality, and strengthening process descriptions. Conversion pathway fixes are usually copy changes and structural simplifications, not visual redesigns. A redesign can improve trust signals, but if the core messaging isn’t specific and your offer isn’t clear, a redesign won’t move conversion rates in any meaningful way.
Why does my bounce rate look acceptable if my conversion rate is poor?
Bounce rate and engagement rate measure user behavior, not user intent. A reader who came to learn something informational and left after reading your article performed exactly as expected. That’s not a failure; it’s the nature of informational content. Your engagement metrics look acceptable because your informational content is doing its job: it’s engaging informational-intent visitors. The conversion problem exists because that same content isn’t attracting buyers. The two metrics measure different things, which is why they can be simultaneously acceptable and misleading when viewed without intent segmentation.
How long does it take to see results after addressing these issues?
It depends on which failure mode you’re fixing. Conversion pathway fixes (clearer CTAs, reduced form friction, better next-step specificity) can show measurable improvements within two to four weeks. Trust infrastructure rewrites (better case studies, more specific service page language) typically show impact within 30 to 60 days as the improved pages accumulate traffic. Traffic intent composition changes take the longest: developing and ranking commercial-intent content typically requires three to six months before traffic composition shifts meaningfully. This is why the diagnostic order matters: fix the fastest-feedback failures while simultaneously beginning the longer-term strategic work.
What tools do I need to run this diagnostic?
Three tools cover 90 percent of the diagnostic work, and two of them are free:
1. Google Search Console (free): Traffic intent audit, query-level analysis
2. Google Analytics 4 (free): Funnel exploration, landing page segmentation, form interaction tracking, conversion correlation
3. Microsoft Clarity (free): Session recordings, heatmaps, rage click detection, scroll depth analysis
If you’re already using GA4 with Enhanced Measurement enabled, you likely have most of the data you need. The diagnostic is primarily a matter of knowing what to look for and where.
Does AI search make the traffic-conversion problem worse?
For sites built primarily on informational content, yes, but indirectly. Google AI Overviews are absorbing a growing share of informational queries, which reduces click-through traffic from those searches. If your traffic model was built on educational content driving high volume with the expectation that some fraction would convert, that model is under structural pressure. The visitors who do click through to your site are increasingly those with more specific intent, which can actually improve your conversion rate on remaining traffic even as volume decreases. The net impact depends entirely on your content mix. Sites with strong commercial-intent content infrastructure are less affected. Sites with thin commercial content but high informational volume are most exposed.
Should I focus on getting more traffic or fixing conversions first?
This is the wrong framing. The right question is: what is the intent composition of my existing traffic, and is my site currently capable of converting the commercially-intent visitors who already arrive? If you have qualified traffic that isn’t converting, more traffic amplifies the waste. It doesn’t help. Fix the conversion gap in your existing qualified traffic first. If the diagnostic shows that almost none of your current traffic has commercial intent, then the priority is changing what traffic you attract, which is a content strategy problem, not a traffic volume problem. More traffic from the wrong intent profile doesn’t produce more revenue.
The Bigger Picture
Traffic without conversions is a frustrating problem precisely because the effort you’ve invested in generating that traffic is visible and measurable. The work is real. The gap feels unfair.
But it’s a diagnostic problem, not a failure. Every element of the breakdown is fixable: intent mismatch, trust gaps, unclear pathways. The key is fixing them in the right order, with a way to measure whether each fix is working before moving to the next.
The diagnostic process in this guide isn’t a shortcut. It’s a sequence that makes your effort compound instead of cancel out.
Start with the traffic intent audit this week. Run the numbers in Search Console. Know your intent distribution before you change a single word on your site. That single step, which takes 60 minutes to understand what your traffic actually looks like, will make every subsequent decision more accurate and more efficient.
The system can be fixed. But you have to know which part of the system is broken first.
If you’d rather not run this diagnostic alone, I work with SaaS companies and growing businesses to identify exactly where their organic traffic breaks down, then build the search and content system to close that gap. My work focuses on SaaS SEO, topical authority, and content strategy built for AI-driven search environments. If that’s relevant to your situation, you can reach me at ajitkumargupta.com.